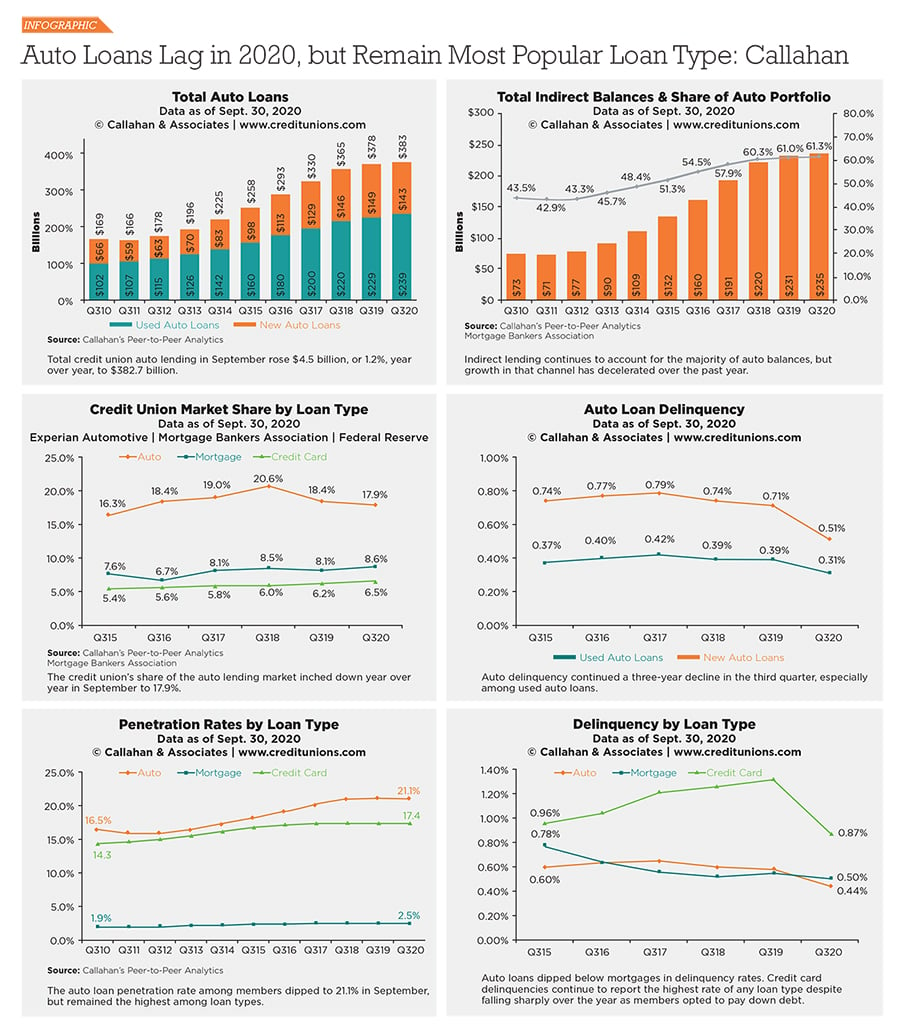
Infographic
Resources

Alkami
From Alkami
This comprehensive market study dives deep into the contrasting views between financial institutions and account holders, offering critical insights that can drive your credit union's strategic decisions.
Download Resource
CPI
From CPI
Discover how to build a strong, efficient card program that aligns with your credit union’s goals, meets members’ needs, and opens the door to new opportunities.
Download Resource
Alkami
From Alkami
The 2025 Digital Sales & Service Maturity Model update reveals how FIs are evolving. Discover why credit unions that prioritize digital maturity will be best positioned to capitalize on revenue growth opportunities.
Download Resource
Eagle Eye Networks
From Eagle Eye Networks
Discover how cloud-based video surveillance and AI are redefining operations, offering more than security by improving fraud detection, member experience, and operational resilience.
Download Resource
Elan Credit Card
From Elan Credit Card
Virtual cards are the next phase of digital payments with 42% of consumers using one within the past 6 months. Learn more about the growing payment method in this new report.
Download Resource
State National
From State National
What credit unions should know about protecting their portfolios.
Download Resource
State National
From State National
If economic shifts are making your organization question its level of portfolio protection, this quick summary will help you compare blanket and self-insurance vs. Collateral Protection Insurance (CPI) to ensure you choose the right program for your credit union.
Download Resource
Genetec
From Genetec
Choosing a physical security solution can be complicated. Check out our checklist of things to consider.
Download Resource
Genetec
From Genetec
Is your credit union still relying on outdated physical security systems that limit scalability and create siloes in your operations? Download this white paper to explore a clear path to a more resilient and agile security framework that enhances safety, streamlines operations, and ensures compliance.
Download Resource
Elan Credit Card
From Elan Credit Card
Did you know that nearly three-quarters of all banking interactions now happen through digital channels? A well-designed mobile banking app is no longer optional -- it’s essential.
Download Resource
Alkami
From Alkami
What’s going on in digital banking? This sixth edition report explores KPIs and metrics to gauge your credit union’s progress, effectiveness, and efficiency in digital banking services.
Download Resource
Elan Credit Card
From Elan Credit Card
Social media scams, phishing, and telephone-oriented attack delivery are a few of the increasingly sophisticated attack methods by cybercriminals. Learn more about these evolving techniques and how to protect your members.
Download Resource
Elan Credit Card
From Elan Credit Card
Unlock insights into the spending habits and motivations of new cardholders! Explore why so many chose general-purpose credit cards and what this trend means for industry leaders.
Download Resource
Elan Credit Card
From Elan Credit Card
Struggling to keep your credit card program profitable? Discover why many leaders are turning to the agent issuing model.
Download Resource
Elan Credit Card
From Elan Credit Card
Does the value outweigh the risk? Review three key considerations when evaluating whether to invest in growing an internal credit card program or explore an outsourced solution.
Download Resource
Elan Credit Card
From Elan Credit Card
As quickly as technology advances, so do the expectations of your members. Learn what digital capabilities and solutions are trending, how much credit unions are investing, and what’s next in payments innovation.
Download Resource
Elan Credit Card
From Elan Credit Card
Consumers with general-use credit cards average 37% higher monthly spend than those with co-branded cards. Learn more preferences, habits, and trends in this new report from Elan Credit Card and PYMNTS Intelligence.
Download Resource
Elan Credit Card
From Elan Credit Card
Struggling to find the balance between an appealing credit card rewards program and the cost of managing it? These consumer trends and industry perspectives will help guide your credit union to building a viable program in 2025.
Download Resource
Alkami
From Alkami
The future of banking demands more than innovation--it requires actionable strategies. This 2025 playbook outlines 3 key strategies your credit union must adopt to thrive.
Download Resource
Alkami
From Alkami
Packed with data, insights and actionable strategies, this report outlines how your credit union can accelerate digital transformation initiatives in business banking to maintain market share in the increasingly competitive sector.
Download Resource
Alkami
From Alkami
This comprehensive market study dives deep into the contrasting views between financial institutions and account holders, offering critical insights that can drive your credit union's strategic decisions.
Download Resource
CPI
From CPI
Discover how to build a strong, efficient card program that aligns with your credit union’s goals, meets members’ needs, and opens the door to new opportunities.
Download Resource
Alkami
From Alkami
The 2025 Digital Sales & Service Maturity Model update reveals how FIs are evolving. Discover why credit unions that prioritize digital maturity will be best positioned to capitalize on revenue growth opportunities.
Download Resource
Eagle Eye Networks
From Eagle Eye Networks
Discover how cloud-based video surveillance and AI are redefining operations, offering more than security by improving fraud detection, member experience, and operational resilience.
Download Resource
Elan Credit Card
From Elan Credit Card
Virtual cards are the next phase of digital payments with 42% of consumers using one within the past 6 months. Learn more about the growing payment method in this new report.
Download Resource
State National
From State National
What credit unions should know about protecting their portfolios.
Download Resource
State National
From State National
If economic shifts are making your organization question its level of portfolio protection, this quick summary will help you compare blanket and self-insurance vs. Collateral Protection Insurance (CPI) to ensure you choose the right program for your credit union.
Download Resource
Genetec
From Genetec
Choosing a physical security solution can be complicated. Check out our checklist of things to consider.
Download Resource
Genetec
From Genetec
Is your credit union still relying on outdated physical security systems that limit scalability and create siloes in your operations? Download this white paper to explore a clear path to a more resilient and agile security framework that enhances safety, streamlines operations, and ensures compliance.
Download Resource
Elan Credit Card
From Elan Credit Card
Did you know that nearly three-quarters of all banking interactions now happen through digital channels? A well-designed mobile banking app is no longer optional -- it’s essential.
Download Resource
Alkami
From Alkami
What’s going on in digital banking? This sixth edition report explores KPIs and metrics to gauge your credit union’s progress, effectiveness, and efficiency in digital banking services.
Download Resource
Elan Credit Card
From Elan Credit Card
Social media scams, phishing, and telephone-oriented attack delivery are a few of the increasingly sophisticated attack methods by cybercriminals. Learn more about these evolving techniques and how to protect your members.
Download Resource
Elan Credit Card
From Elan Credit Card
Unlock insights into the spending habits and motivations of new cardholders! Explore why so many chose general-purpose credit cards and what this trend means for industry leaders.
Download Resource
Elan Credit Card
From Elan Credit Card
Struggling to keep your credit card program profitable? Discover why many leaders are turning to the agent issuing model.
Download Resource
Elan Credit Card
From Elan Credit Card
Does the value outweigh the risk? Review three key considerations when evaluating whether to invest in growing an internal credit card program or explore an outsourced solution.
Download Resource
Elan Credit Card
From Elan Credit Card
As quickly as technology advances, so do the expectations of your members. Learn what digital capabilities and solutions are trending, how much credit unions are investing, and what’s next in payments innovation.
Download Resource
Elan Credit Card
From Elan Credit Card
Consumers with general-use credit cards average 37% higher monthly spend than those with co-branded cards. Learn more preferences, habits, and trends in this new report from Elan Credit Card and PYMNTS Intelligence.
Download Resource
Elan Credit Card
From Elan Credit Card
Struggling to find the balance between an appealing credit card rewards program and the cost of managing it? These consumer trends and industry perspectives will help guide your credit union to building a viable program in 2025.
Download Resource
Alkami
From Alkami
The future of banking demands more than innovation--it requires actionable strategies. This 2025 playbook outlines 3 key strategies your credit union must adopt to thrive.
Download Resource
Alkami
From Alkami
Packed with data, insights and actionable strategies, this report outlines how your credit union can accelerate digital transformation initiatives in business banking to maintain market share in the increasingly competitive sector.
Download Resource
Alkami
From Alkami
This comprehensive market study dives deep into the contrasting views between financial institutions and account holders, offering critical insights that can drive your credit union's strategic decisions.
Download Resource
