Credit union net income fell in the third quarter as loan quality deteriorated sharply and consumer loan originations slumped.
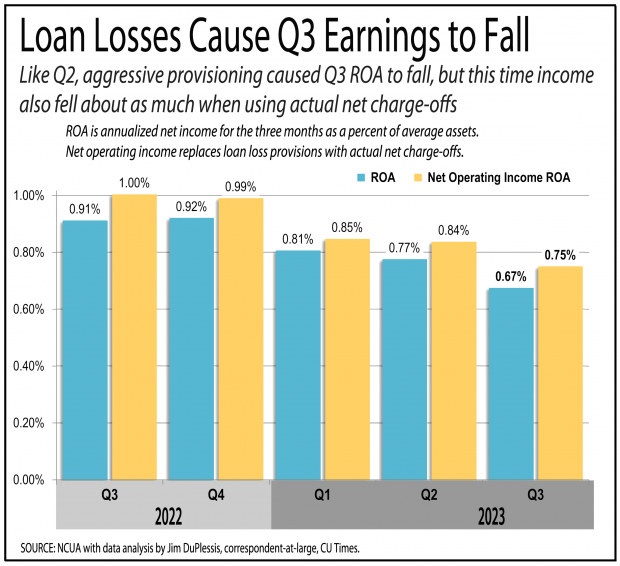
NCUA data released Thursday showed the nation's 4,745 credit unions generated $3.8 billion in net income in the three months ending Sept. 30, or an annualized 0.67% of average assets. That's down from ROA of 0.91% a year earlier and 0.77% in the second quarter.
Recommended For You
As in many quarters, the main culprit in the drop in ROA was a steep increase in the provisions credit unions took for anticipated loan losses. In many past quarters the anticipation was far higher than actual charge offs, but in the third quarter they were about the same.
NCUA Board Chair Todd Harper, speaking with reporters before the data release, said he was concerned by the sharp rise in delinquencies from June to September, especially for car loans and credit cards, which are often a bellwether of household financial distress.
 Todd Harper
 Harper said mortgage delinquencies, which were 0.49% Sept. 30, were back to a historically normal level, after being far below normal since the pandemic. And he said both auto and credit card delinquency rates are now above levels seen in years before the pandemic.
The credit card delinquency rate of 1.90% was up 60 basis points from a year earlier and up 36 bps from June, a three-month rise Harper said "is well above historical averages."
The auto loan delinquency rate was 0.78%, up 25 bps from a year earlier, with the bulk of the delinquency problem in used car loans, where credit unions are the leading lender.

Only $755 million in new car loans were 60-plus days delinquent Sept. 30, compared with $3.2 billion in used cars loans. The used car delinquency rate was 0.98% Sept. 30, up from 0.65% a year earlier and 0.84% in June.
At the end of September, $11.5 billion of credit union loans were at least 60 days delinquent. The resulting 0.72% delinquency rate was up from 0.53% a year earlier and 0.63% in June.
Harper was also concerned by the drop in average deposits from the second quarter to the third quarter.
Savings were $1.89 trillion Sept. 30, up 1.3% from a year earlier and down 0.1% from the previous quarter. The average savings balance was $6,842, down 4.2% from a year earlier down 1.3% from June.
Harper said credit unions are trying to compensate through fast growth of high-cost timed deposits.
However, the likelihood that rates will fall over the coming year raises risks for credit unions, which tend to re-price loan rates quickly while delaying increases in savings rates.
The result is that recent increases in deposit rates on long-term certificates of deposits will eat into net interest margins in coming years, Harper said.
The slowdown in savings and is putting liquidity pressures on credit unions, which is contributing to a slowdown in loan growth.
Credit unions held $1.6 trillion in loans Sept. 30, up 9.4% from a year earlier and up 1.8% from June. The loan-to-share ratio was 84.7%, up from 78.4% a year earlier and 83.1% in June.
Real estate originations rose from the second quarter to the third quarter, while volume fell for commercial loans and the consumer loan category that includes auto loans.
Total production was $141.8 billion in in the three months ending Sept. 30, down 28% from a year earlier, and down 4.3% from the second quarter. Weighted for assets, the drop is even steeper. Total originations were 25% of average assets in the third quarter, down from 36% a year earlier.
Originations by category for the three months ending Sept. 30 were:
- First mortgage originations were $28.8 billion, down 33.4% from a year earlier, and up 11.9% from the second quarter.
- Home equity lines of credit and other second-lien real estate originations were $16.2 billion, down 19.8% from a year earlier, and up 15.1% from the second quarter.
- Commercial production was $8.7 billion, down 39.7% from a year earlier, and down 9.8% from the second quarter.
- Auto and other consumer loan originations were $88.1 billion, or more than half of the quarter's total originations. The consumer originations were down 25.8% from a year earlier, and down 10.8% from the second quarter.

NCUA data doesn't isolate auto loan originations, but balance sheet data shows auto loans accounted for 77% of consumer loans. The remainder is dominated by credit cards and personal loans, which have been growing faster than other loans, while auto loan growth has slowed well below other loan types.
Net income in the third quarter was supported by continuing high net interest margins. It was 3.02% in the third quarter, up from 3.01% a year earlier and 3.00% in the second quarter.
The net interest margin has been at or above 3% for the past five quarters after ranging from 2.86% in the second quarter of 2020, at the start of the pandemic, to 2.44% in the second quarter of 2022.
Credit union pay and other overhead costs rose slightly faster than net revenue, cutting 3 basis points from ROA both from a year ago and from the second quarter.
Provisions for loan losses have been rising steadily over the past year, but the increase was particularly large from the second quarter's 0.44% of average assets to the third quarter's 0.51% of average assets.
During the first year of the pandemic, credit unions reacted to the unknown by over-provisioning, so it became useful in the past few years to look at operating net income, which replaces the exaggerated provisions with actual net charge offs.
However, there was little difference in the third quarter. Net charge offs in the third quarter were 0.43% of average assets, up from 0.23% a year earlier and 0.37% in the second quarter.
The net charge offs were weighted above by average assets to compare them to provisions.
The traditional weighting by average loans shows the net charge off ratio was 0.61% in the third quarter, up from 0.34% a year earlier and 0.54% in the second quarter.
© Touchpoint Markets, All Rights Reserved. Request academic re-use from www.copyright.com. All other uses, submit a request to [email protected]. For more inforrmation visit Asset & Logo Licensing.
Jim DuPlessis

Jim covers economic data trends emerging for credit unions, as well as branch news and dividends.


