 Larger credit unions, which can more easily benefit from economies of scale, have a higher likelihood of offering a variety of electronic services.
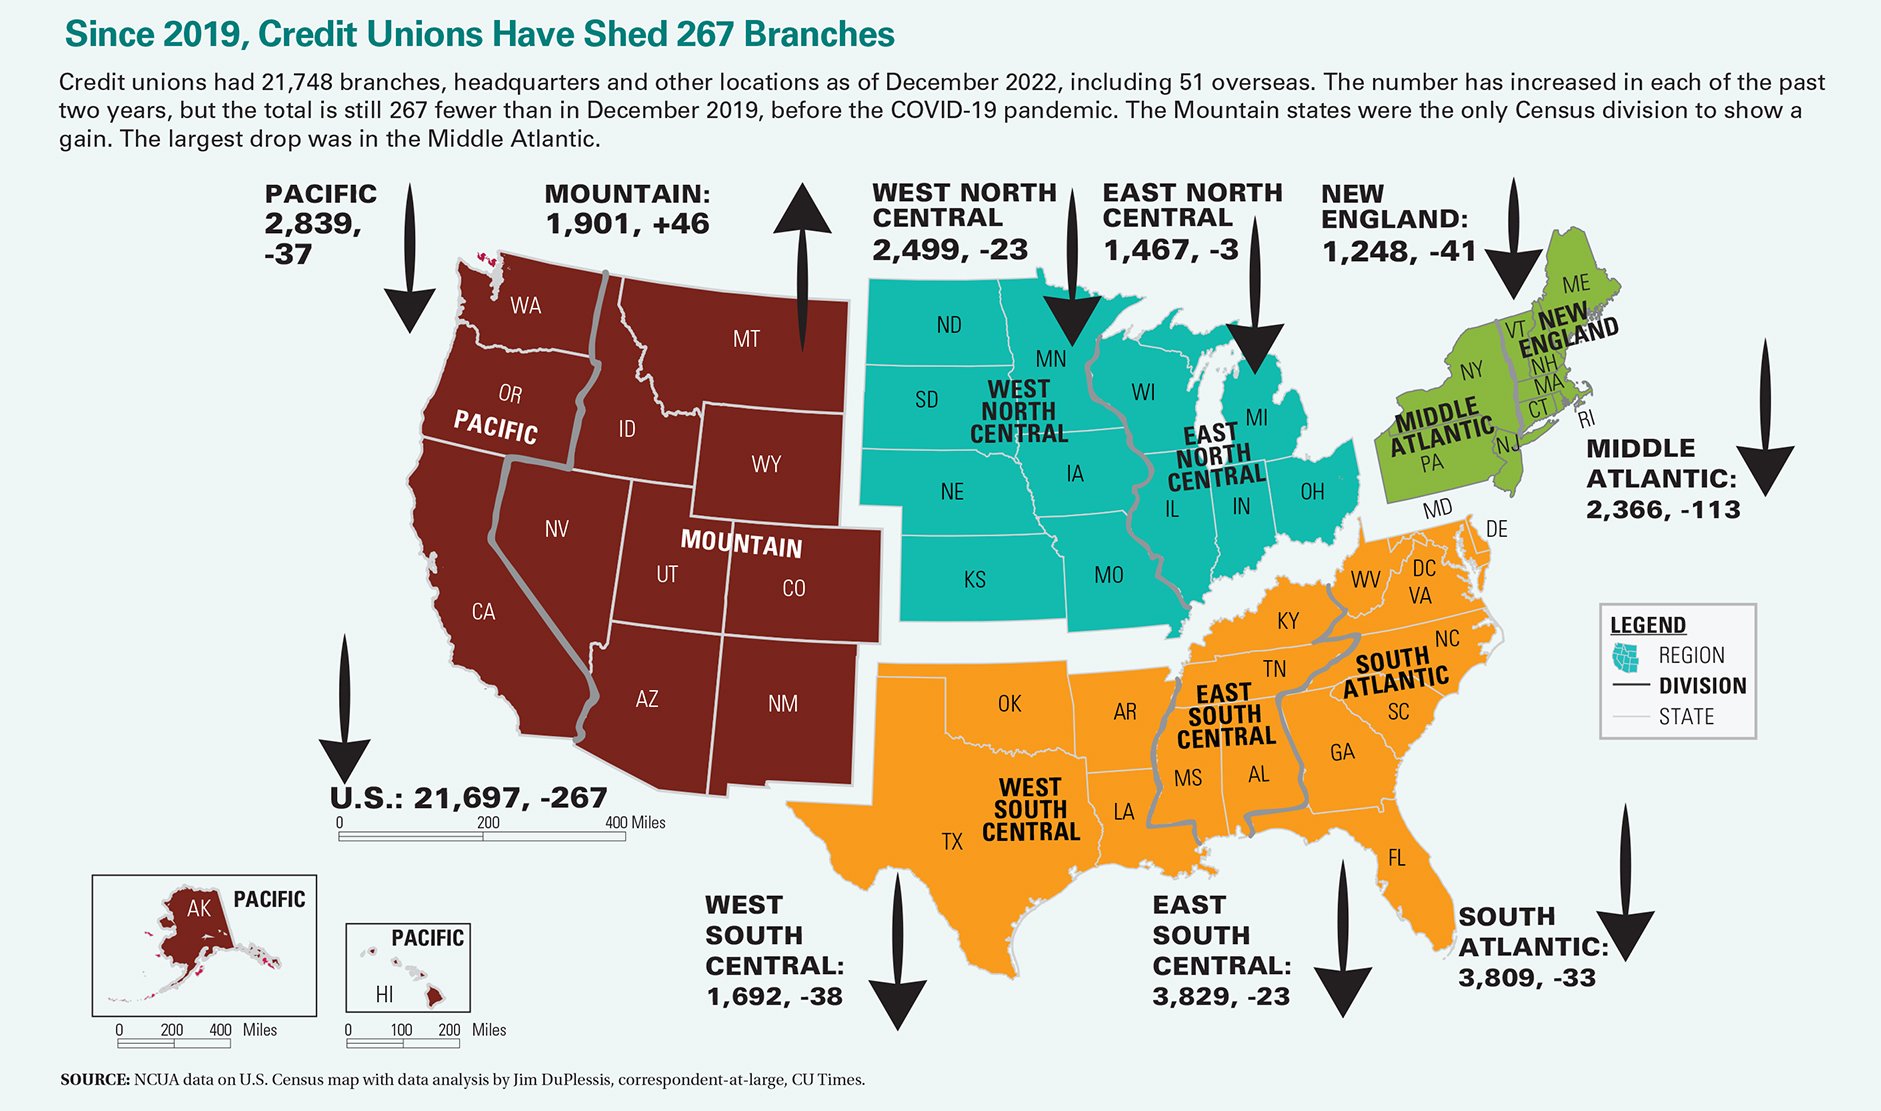
  This heat map shows the changes in the number of credit union branches by state from June 2017 to June 2018.
  The amount of revenue generated per dollar spent on salary and benefits among America's credit unions has risen 10.2% in the past five years.
  The average member relationship among U.S. credit unions is up 19.9% since 2014, exceeding $19,000 as of the first quarter of 2019. Source: Callahan's Peer-to-Peer Analytics
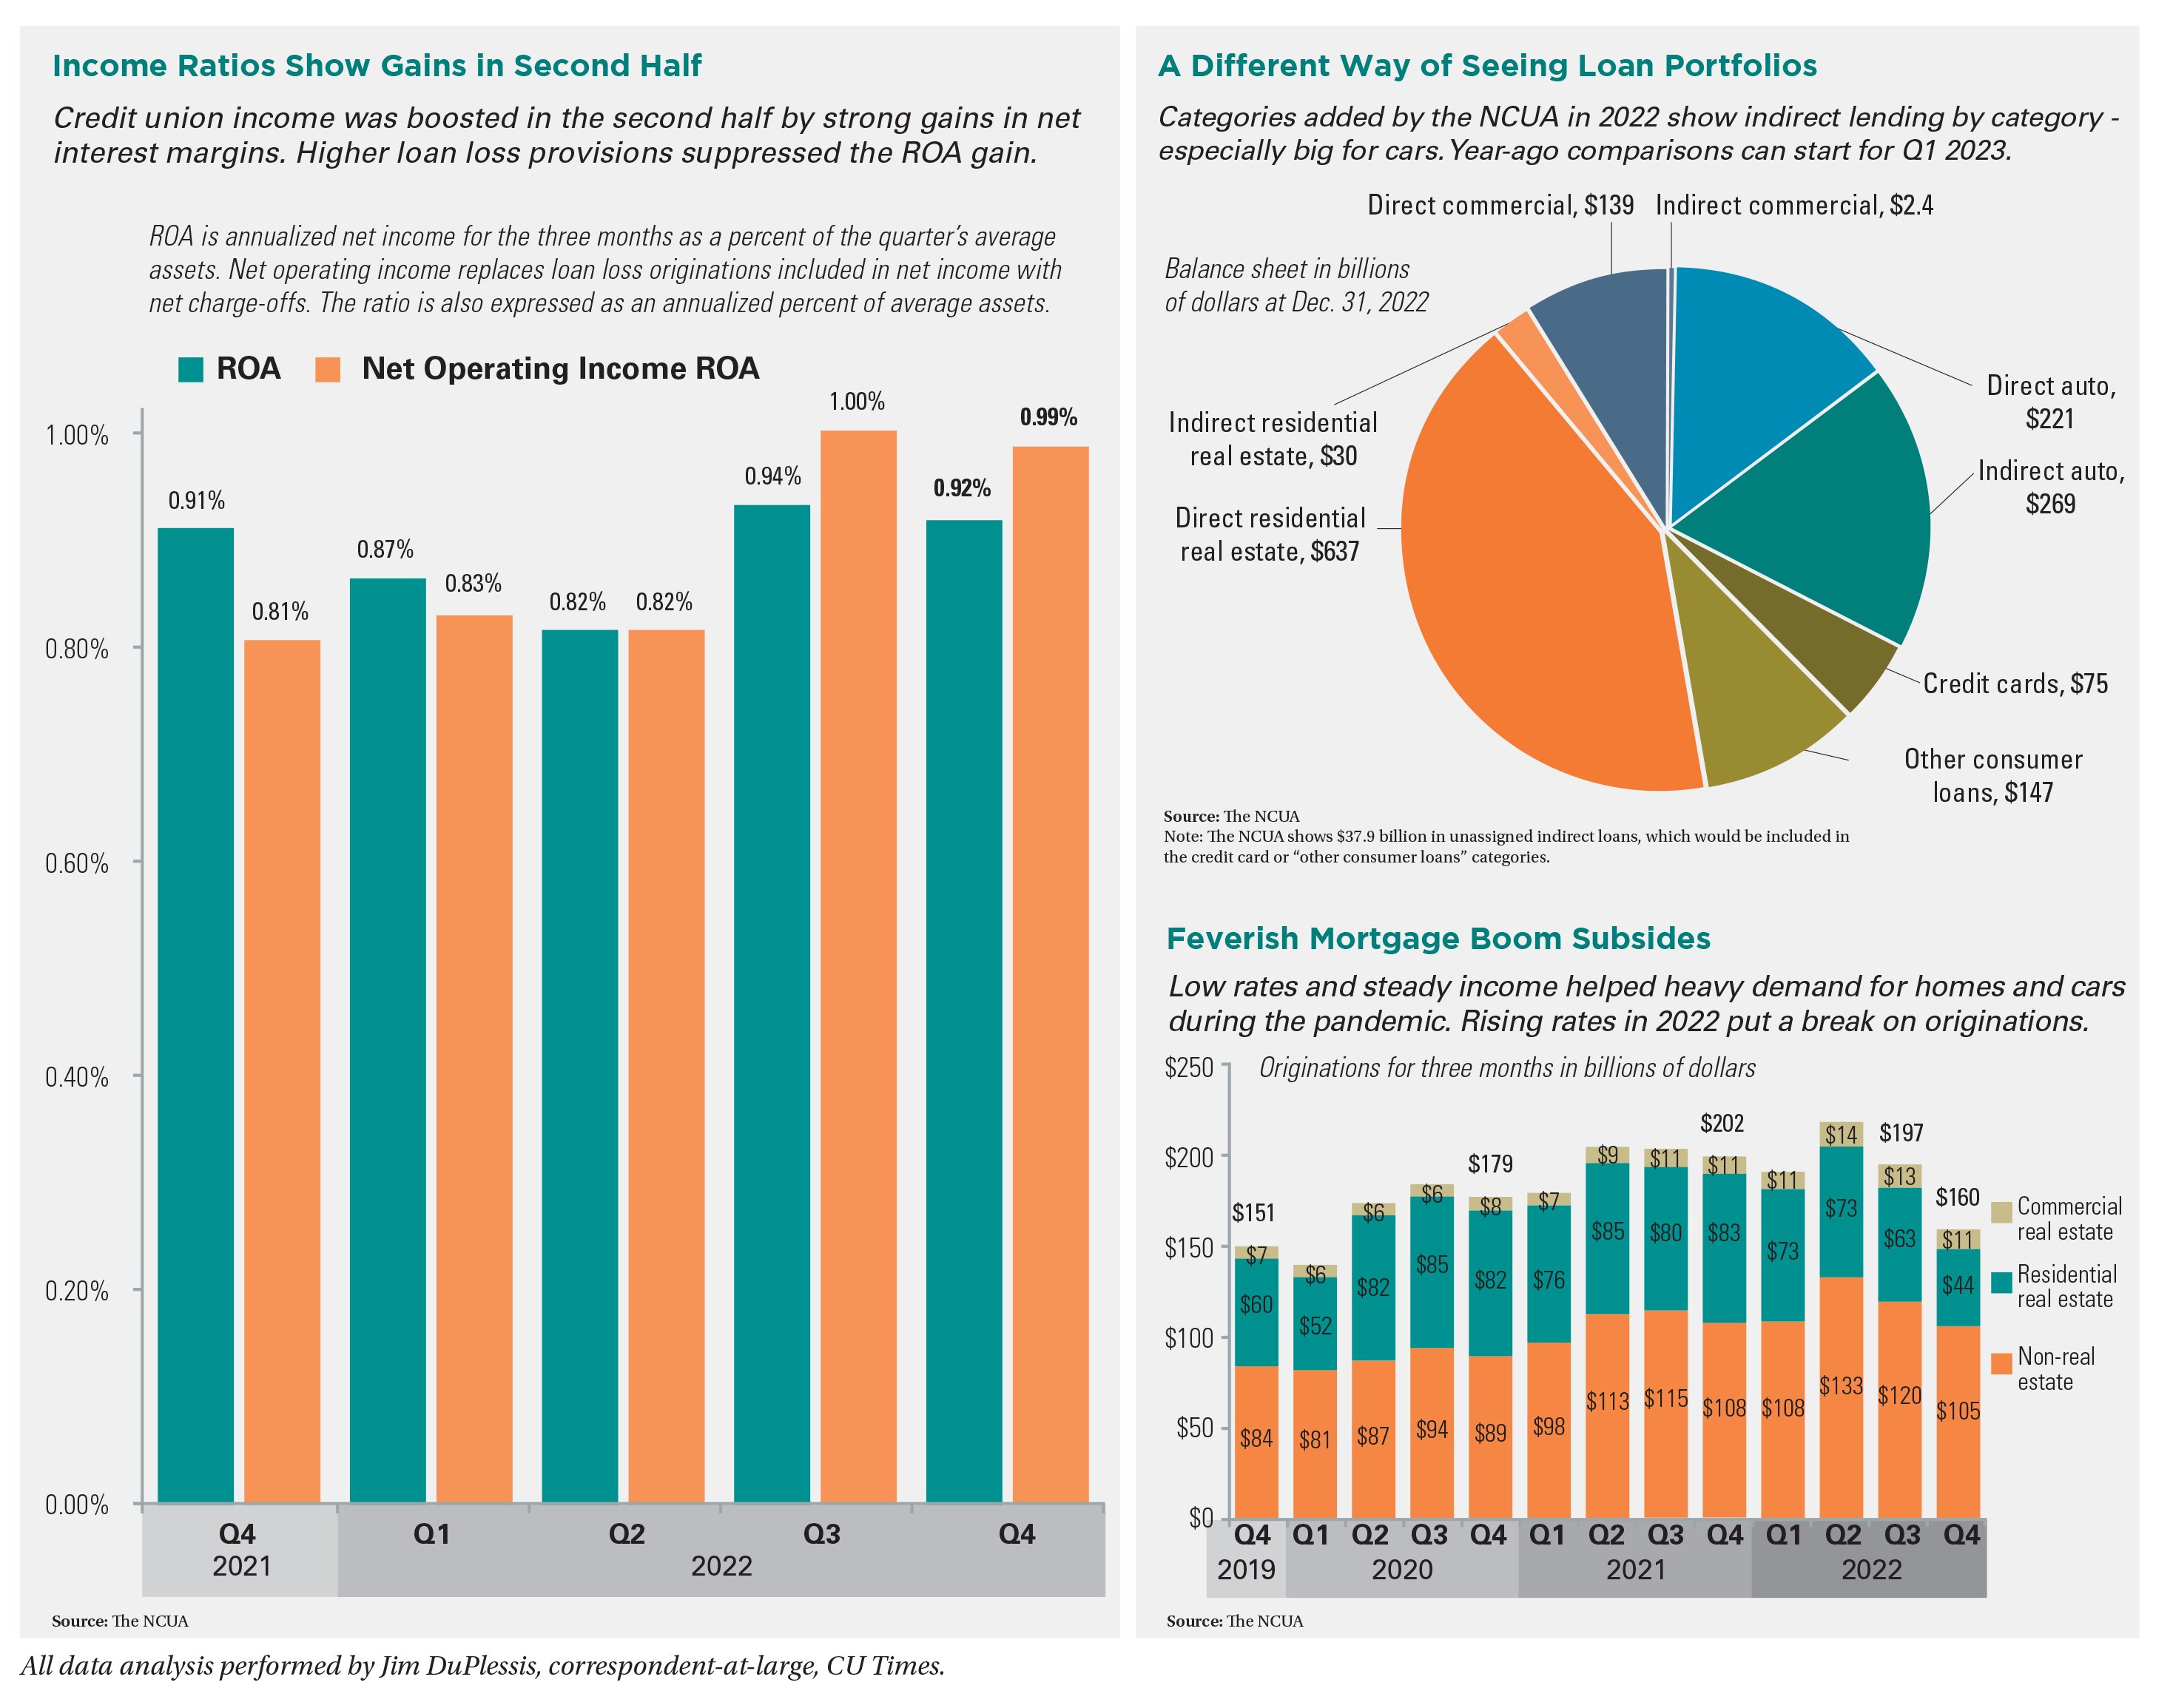
  Left: The net interest margin and operating expense ratios increased nine and three basis points, respectively, both reaching 3.12% by March 2019. In the first quarter of 2014, the operating expense ratio exceeded the net interest margin by 24 basis points. Source: Callahan's Peer-to-Peer Analytics. Right: The efficiency ratio, which represents how much it costs a credit union to generate a dollar in revenue, dropped 2.6 percentage points in the past five years to 78.1% as of March 2019, largely due to retail delivery, including branching, becoming more efficient.
  Credit union membership in the United States has grown 20.5% in the past five years. As of March 31, credit unions reported 118.6 million members, 36.1% of the total U.S. population, which was 328.2 million on Jan. 1, 2019, according to the U.S. Census Bureau. Source: Callahan's Peer-to-Peer Analytics
Recommended For You
© Touchpoint Markets, All Rights Reserved. Request academic re-use from www.copyright.com. All other uses, submit a request to [email protected]. For more inforrmation visit Asset & Logo Licensing.


