Are you successful? Do you feel successful? Are the people around you successful? If surrounding oneself with success improves one's chances of success, then perhaps the folks at GOBankingRates.com are on to something.
GOBankingRates.com wondered whether a “successful” state is considered so because of how its government is run and the economy's performance, or because of how financially successful its residents may be.
And, curious as ever, they decided to run the numbers, including both those factors, to see which of the 50 states and the District of Columbia would be judged most and least successful.
They ranked states by seven factors:
- Average income of the top 1%
- Average income of the bottom 99%
- Poverty rates
- Percentage of the population in the upper, middle and lower class
- Number of millionaire households.
- Ratio of millionaires to total households.
- Number of billionaires.
If you're interested in seeing how your state stacks up, successwise, compared with the top 10, just read on:
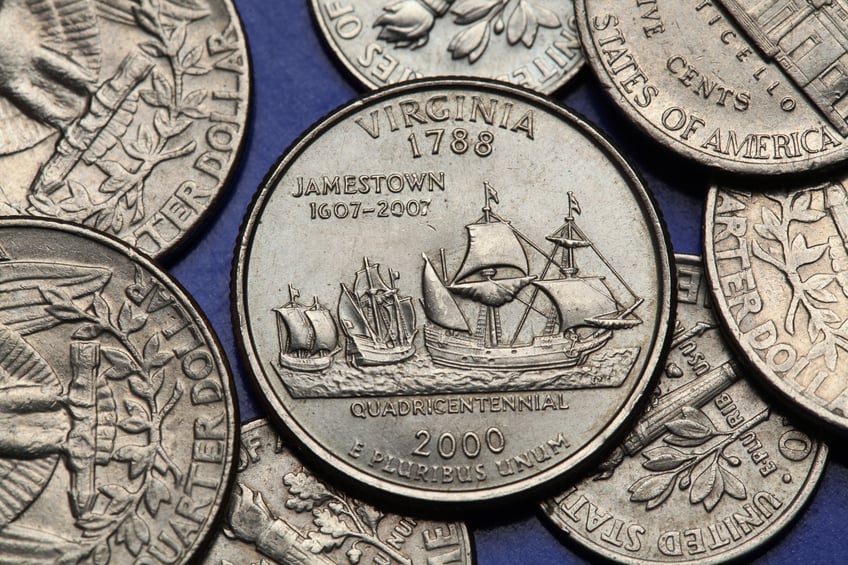
Virginia's poverty rate is relatively low. (Photo: iStock)
10. Virginia
Average income of top 1%: $987,607.
Average income of bottom 99%: $55,743.
Number of millionaire households: 208,187.
Ratio of millionaires to total households: 6.64%.
Number of billionaires: 5.
Population in upper class: 26%.
Population in middle class: 51%.
Population in lower class: 24%.
Overall poverty rate: 11.8.
With the eighth highest number of millionaire households in the country, Virginia also has one of the highest percentages of upper-class residents.
Its poverty rate is one of the lowest in the nation, too — an indicator of success.

Sparsely populated North Dakota has 13,494 millionaire households. (Photo: iStock)
9. North Dakota
Average income of top 1%: $1.28 million.
Average income of bottom 99%: $61,178.
Number of millionaire households: 13,494.
Ratio of millionaires to total households: 4.59%.
Number of billionaires: 0.
Population in upper class: 25%.
Population in middle class: 56%.
Population in lower class: 19%.
Overall poverty rate: 11.5.
While only Wyoming has fewer millionaire households, the average income of the bottom 99% in North Dakota is higher than in Wyoming — and most of the other states, too.
North Dakota also has the smallest percentage of its population in the lower class among all states.

The average income of Alaska's 99 percent is one of the highest in the U.S. (Photo: iStock)
8. Alaska
Average income of top 1%: $833,117.
Average income of bottom 99%: $63,226.
Number of millionaire households: 18,209.
Ratio of millionaires to total households: 6.75%.
Number of billionaires: 0.
Population in upper class: 25%.
Population in middle class: 53%.
Population in lower class: 22%.
Overall poverty rate: 11.2.
While it doesn't have as many millionaire households as most states, the ratio of millionaires to total households is one of the highest in the country.
In addition, the average income of the bottom 99% is one of the highest in the U.S., boosting the Last Frontier's overall standings.

California boasts more millionaire households than the total number of households in the state of Wyoming, which has 225,514, according to the U.S. Census. (Photo: iStock)
7. California
Average income of top 1%: $1.41 million.
Average income of bottom 99%: $48,899.
Number of millionaire households: 777,624.
Ratio of millionaires to total households: 6.04%.
Number of billionaires: 124.
Population in upper class: 19%.
Population in middle class: 48%.
Population in lower class: 33%.
Overall poverty rate: 16.4.
It would be surprising if the home of Silicon Valley didn't have the highest number of millionaire households and billionaires.
But of course it does, although the fact that it has a much higher percentage of its population in the lower class than the top five successful states drags it down. In fact, only two states have a larger percentage of their population in the lower class: Mississippi and New Mexico.

The average income of the 1 percent in Washington, D.C., is among the highest in the country. (Photo: iStock)
6. Washington, D.C.
Average income of top 1%: $1.53 million.
Average income of bottom 99%: $63,100.
Number of millionaire households: 17,378.
Ratio of millionaires to total households: 6.10%.
Number of billionaires: N/A.
Population in upper class: 34%.
Population in middle class: 40%.
Population in lower class: 27%.
Overall poverty rate: 17.7.
It's to be expected that the District would finish up near the top, considering how many governmental and diplomatic luminaries live here. It's also not surprising that the average income of the 1% is among the highest in the country, and that the percentage of its population in the upper class is the highest in the country.
But according to a 2015 Washington Post report, its booming economy is slowing — so if you're aiming for successful surroundings, just keep that in mind.

New Hampshire boasts one billionaire. Oh well. (Photo: iStock)
5. New Hampshire
Average income of top 1%: $1.01 million.
Average income of bottom 99%: $56,475.
Number of millionaire households: 33,867.
Ratio of millionaires to total households: 6.48%.
Number of billionaires: 1.
Population in upper class: 23%.
Population in middle class: 57%.
Population in lower class: 20%.
Overall poverty rate: 9.2.
Just one billionaire here, but that doesn't mean the state isn't doing well for itself. It has one of the highest ratios of millionaires to overall households in the country.
Add to that the fact that the state has the lowest overall poverty rate in the U.S. and the Granite State is looking pretty rock solid.

There's greater income inequality in Massachusetts than in most states. (Photo: iStock)
4. Massachusetts
Average income of top 1%: $1.69 million.
Average income of bottom 99%: $56,115.
Number of millionaire households: 174,225.
Ratio of millionaires to total households: 6.73%.
Number of billionaires: 10.
Population in upper class: 28%.
Population in middle class: 49%.
Population in lower class: 23%.
Overall poverty rate: 11.6.
Massachusetts not only boasts the 10th highest number of millionaire households, its wealthiest woman is Fidelity Investments CEO Abigail Johnson, according to Forbes.
But there's greater income inequality here than in most states, according to the Center on Budget and Policy Priorities. But the income level of the bottom 99% is still higher than in most states, and it has the second-highest percentage of its population in the upper class in the country.

A tip of the hat to New Jersey, which has a higher ratio of millionaires to total number of households than most states. (Photo: iStock)
3. New Jersey
Average income of top 1%: $1.45 million.
Average income of bottom 99%: $57,447.
Number of millionaire households: 242,647.
Ratio of millionaires to total households: 7.49%.
Number of billionaires: 8.
Population in upper class: 25%.
Population in middle class: 51%.
Population in lower class: 25%.
Overall poverty rate: 11.1
Although it only has a little more than half as many millionaire households as neighboring New York, New Jersey isn't doing too badly for itself. It has a higher ratio of millionaires to total number of households — the second highest in the country, in fact.
And the 1% here are doing pretty well for themselves in average income: Sixth from the top in the country.

The millionaire-to-total-household ratio is the highest in Maryland. (Photo: iStock)
2. Maryland
Average income of top 1%: $1.02 million.
Average income of bottom 99%: $60,172.
Number of millionaire households: 169,287.
Ratio of millionaires to total households: 7.70%.
Number of billionaires: 8.
Population in upper class: 26%.
Population in middle class: 52%.
Population in lower class: 22%.
Overall poverty rate: 10.1.
The millionaire-to-total-household ratio is the highest in Maryland than anywhere else in the country.
Low-income folks make up a relatively small proportion of the state's population, too, while the average income of the 99% is one of the highest nationally.
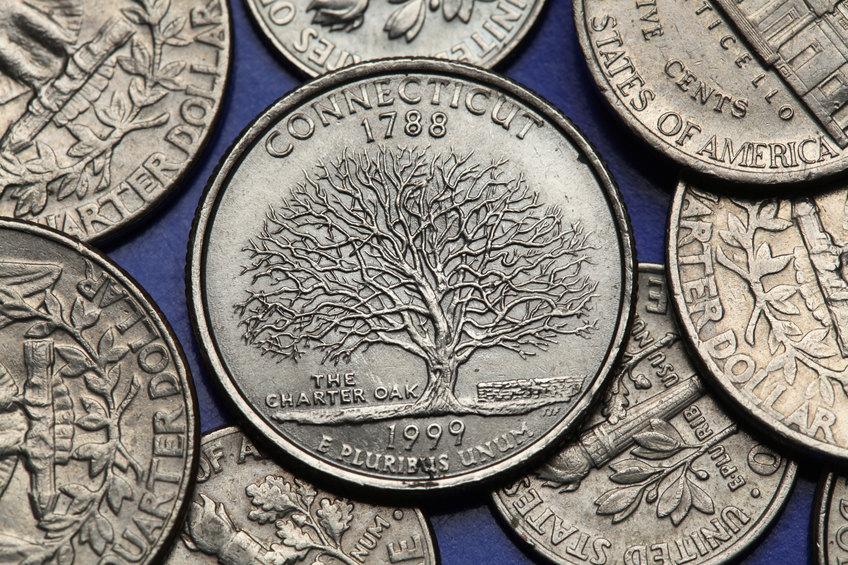
Connecticut has the highest ratio of millionaires to total households, although its bottom 99 percent are doing pretty well, too. (Photo: iStock)
1. Connecticut
Average income of top 1%: $2.4 million.
Average income of bottom 99%: $56,445.
Number of millionaire households: 100,754.
Ratio of millionaires to total households: 7.32%.
Number of billionaires: 12.
Population in upper class: 27%.
Population in middle class: 50%.
Population in lower class: 23%.
Overall poverty rate: 10.8.
If you're looking for successful surroundings, look no further than the Nutmeg State. Not only is the average income of the 1% the highest here, but the state also has the highest ratio of millionaires to total households. “In fact,” said GOBankingRates, “southwestern Connecticut is commonly known as the gold coast because such a large percentage of the population there is wealthy.”
And the bottom 99%? Not doing all that badly either — their average incomes are higher than the incomes in most states.
© Touchpoint Markets, All Rights Reserved. Request academic re-use from www.copyright.com. All other uses, submit a request to [email protected]. For more inforrmation visit Asset & Logo Licensing.


